Published: March 2026
Last Updated: April 2026
INTRODUCTION
Retail participation in Indian financial markets has increased significantly in recent years, particularly in equity and derivatives segments. Investor awareness material published by the Securities and Exchange Board of India (SEBI) emphasizes the importance of understanding how market data is represented and interpreted.
With the growth of digital trading platforms and charting tools, a large number of new participants are exposed to stock charts without a clear understanding of what these charts represent. Data from exchanges such as the National Stock Exchange (NSE) indicates that chart-based observation has become a common way for individuals to interpret price movement.
However, for beginners, stock charts can appear complex and difficult to interpret due to the presence of multiple visual elements such as price bars, time scales, and patterns.
This article is intended to provide educational insights into how stock charts function conceptually and how they represent market behaviour in the Indian financial markets.
WHY THIS TOPIC MATTERS FOR LEARNERS
Beginners entering financial markets are often introduced to charts early in their learning process. However, charts are frequently presented without sufficient explanation of their underlying structure.
In financial education, it is commonly observed that learners attempt to interpret chart patterns without understanding what the chart actually represents. This can lead to confusion and inconsistent interpretation.
Understanding stock charts helps learners:
recognize how price movement is visually represented
understand how time and price interact on a chart
develop clarity in interpreting market behaviour
This contributes to a more structured understanding of financial markets.
What Is a Stock Chart?
A stock chart is a visual representation of price movement of a financial instrument over a specific period of time, displaying how prices change across different time intervals.
It organizes market data into a structured graphical format.
What Is Price Behaviour?
Price behaviour refers to the way in which prices of financial instruments move over time as a result of interactions between buyers and sellers in the market.
It reflects market sentiment, liquidity, and participant activity.
Stock charts are tools used to represent the interaction between buyers and sellers in financial markets. Each movement on a chart reflects changes in demand and supply influenced by market participants.
In Indian financial markets, price data is generated through transactions on exchanges such as NSE and BSE. This data is then visualized through charts, allowing participants to observe how prices evolve over time.
Charts do not predict future movement; instead, they provide a structured way to observe historical price behaviour. Research-oriented observations in financial education suggest that beginners often misinterpret charts because they focus on patterns without understanding the underlying data representation.
Understanding charts conceptually requires recognizing that they are representations of market activity rather than standalone decision tools.
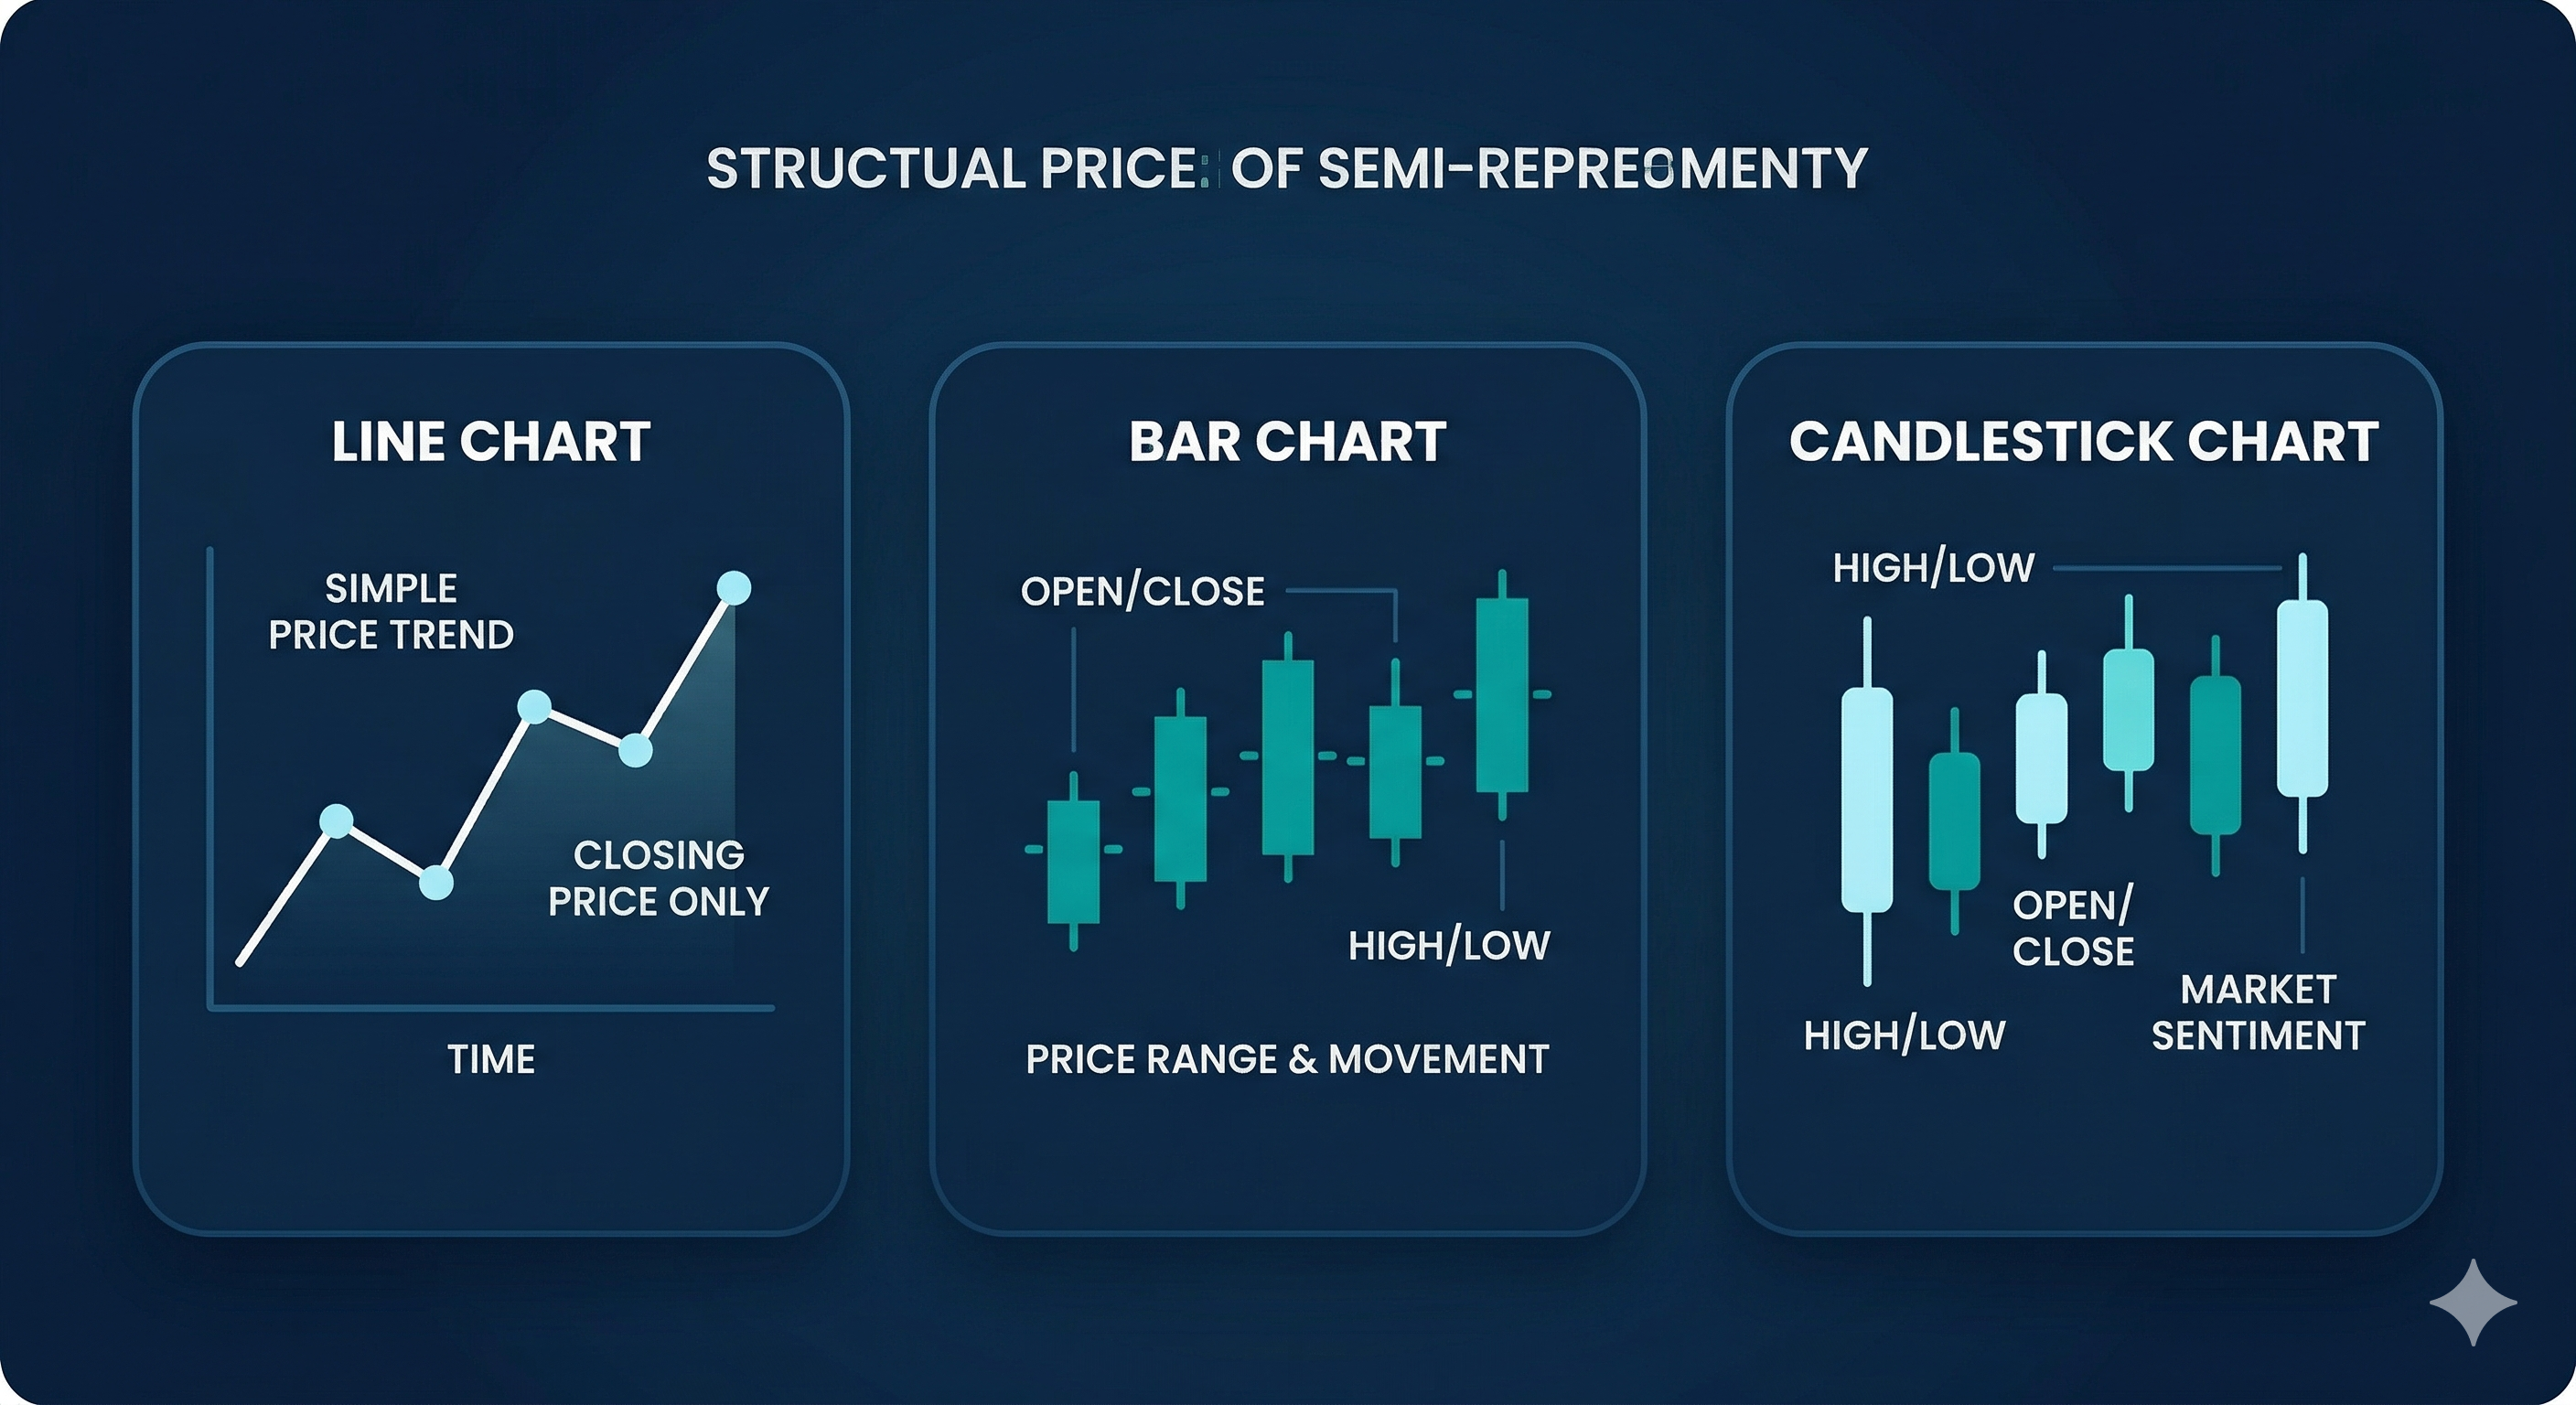
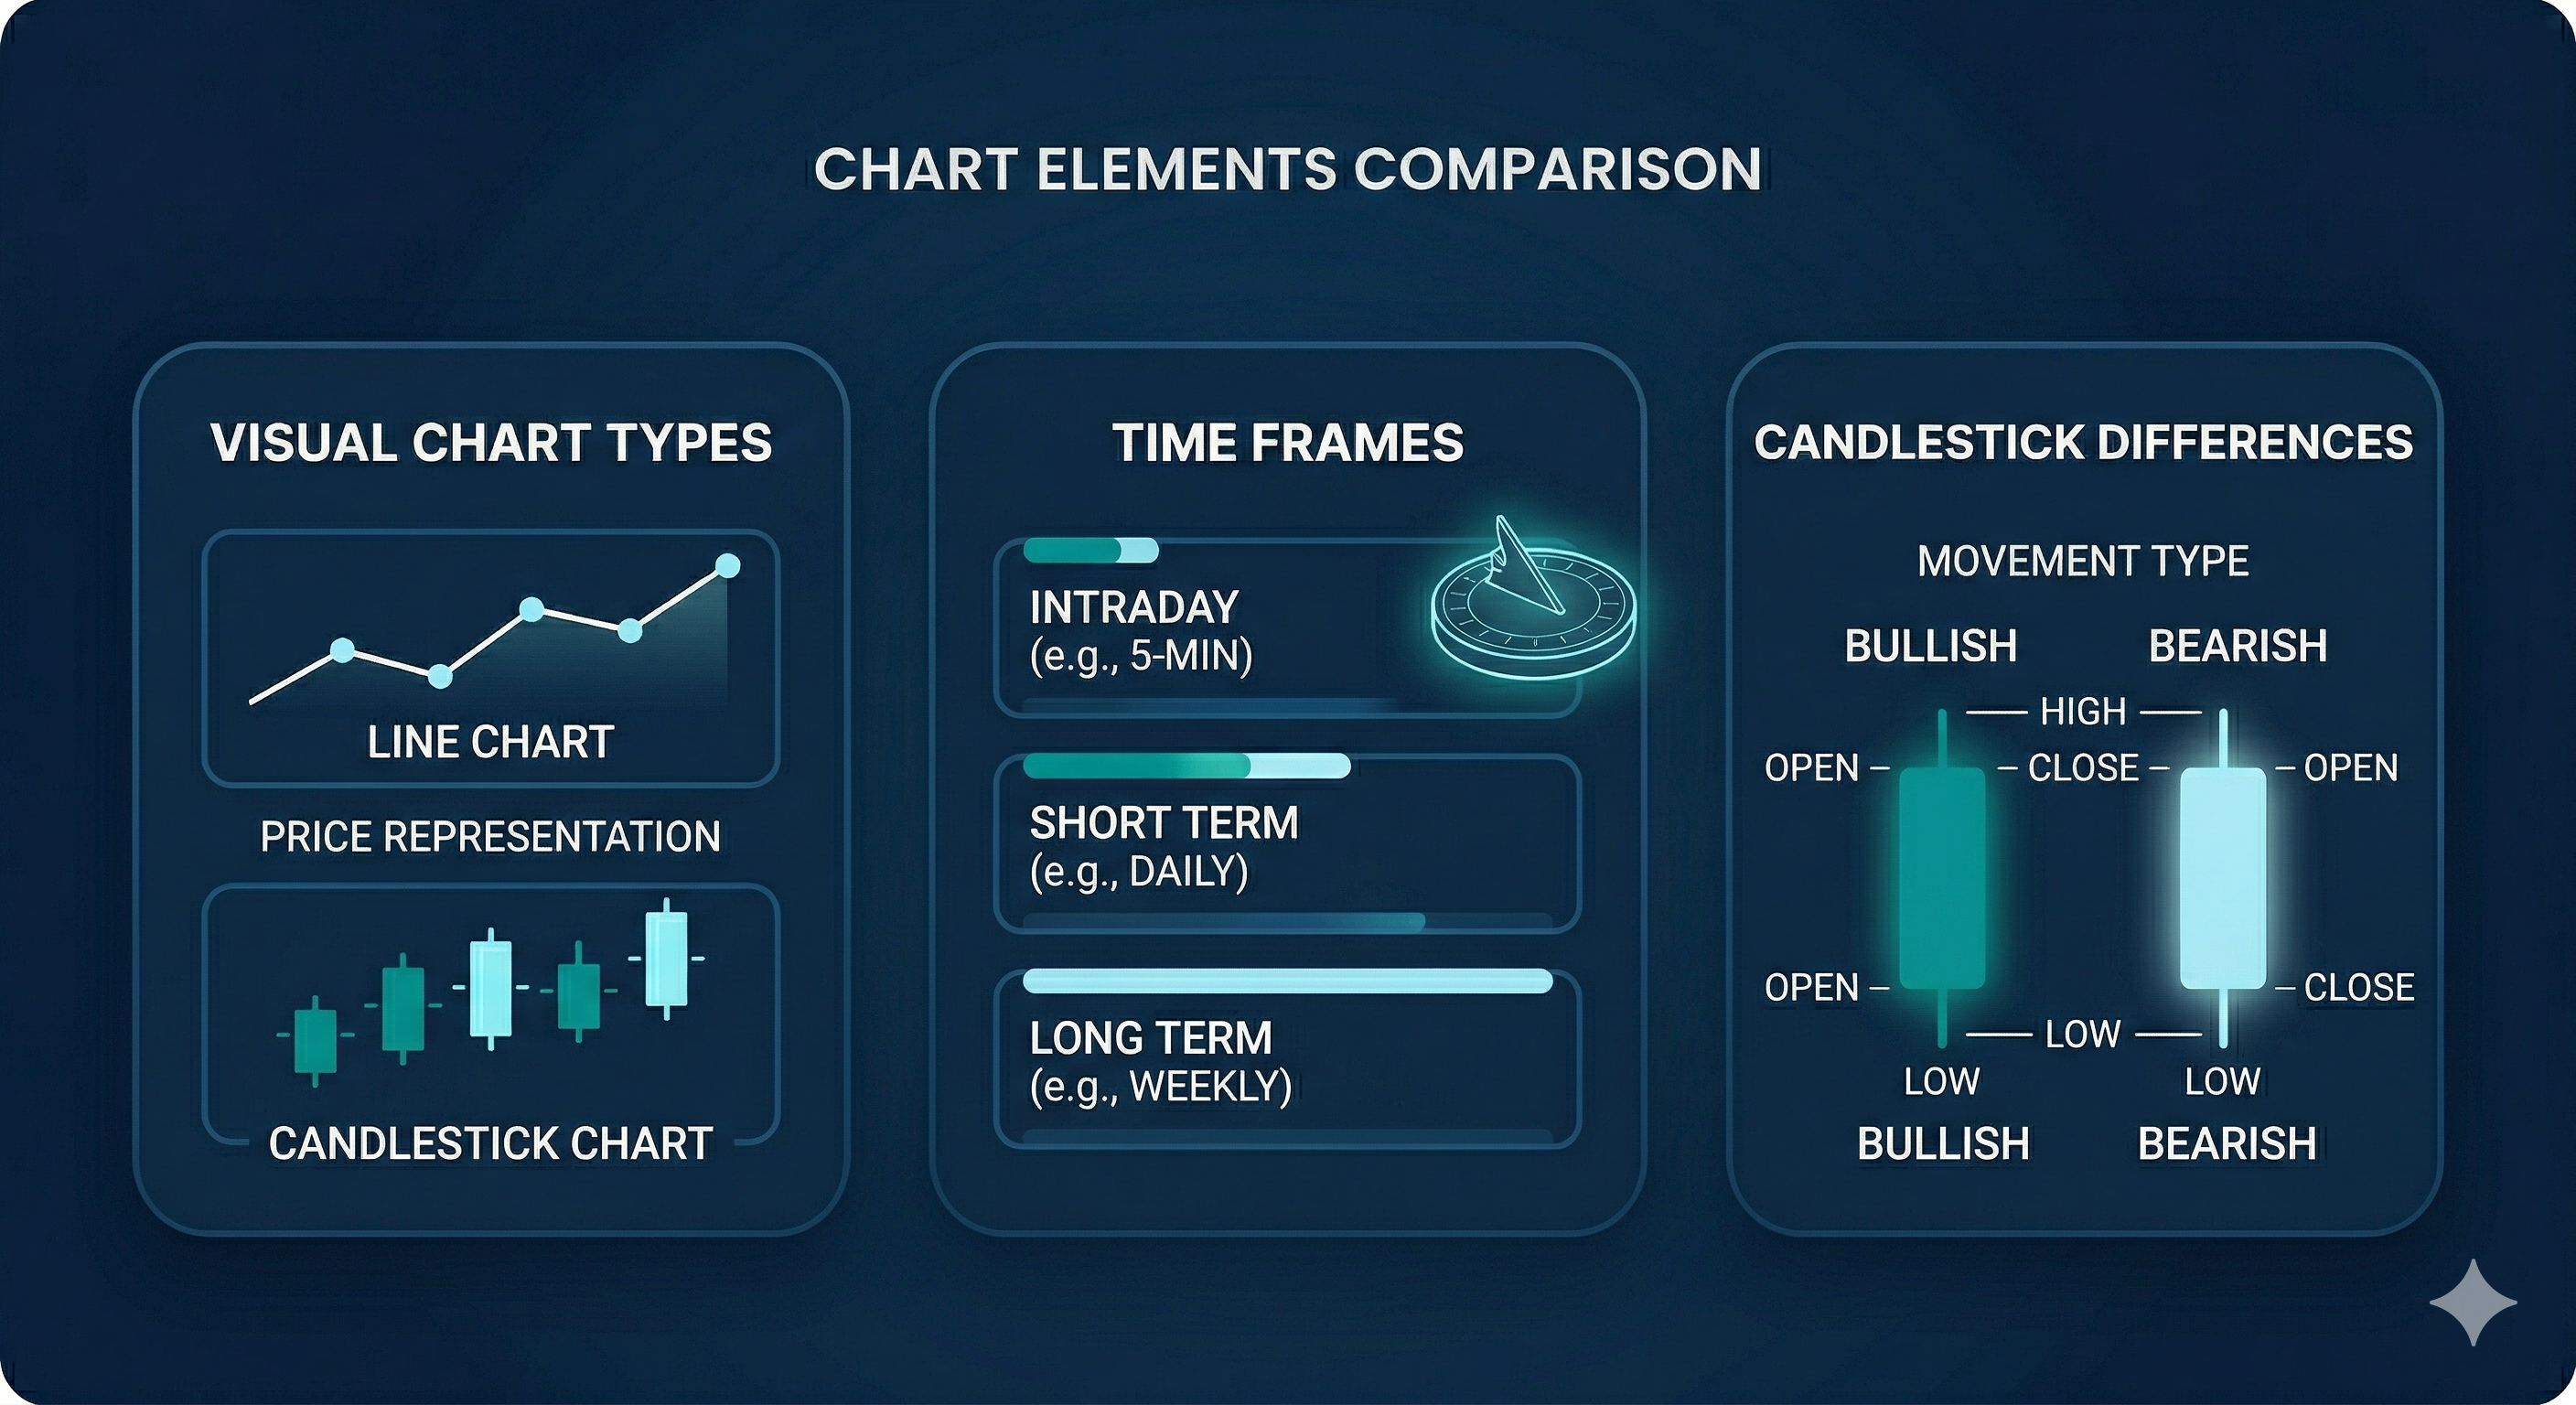
Types of Stock Charts
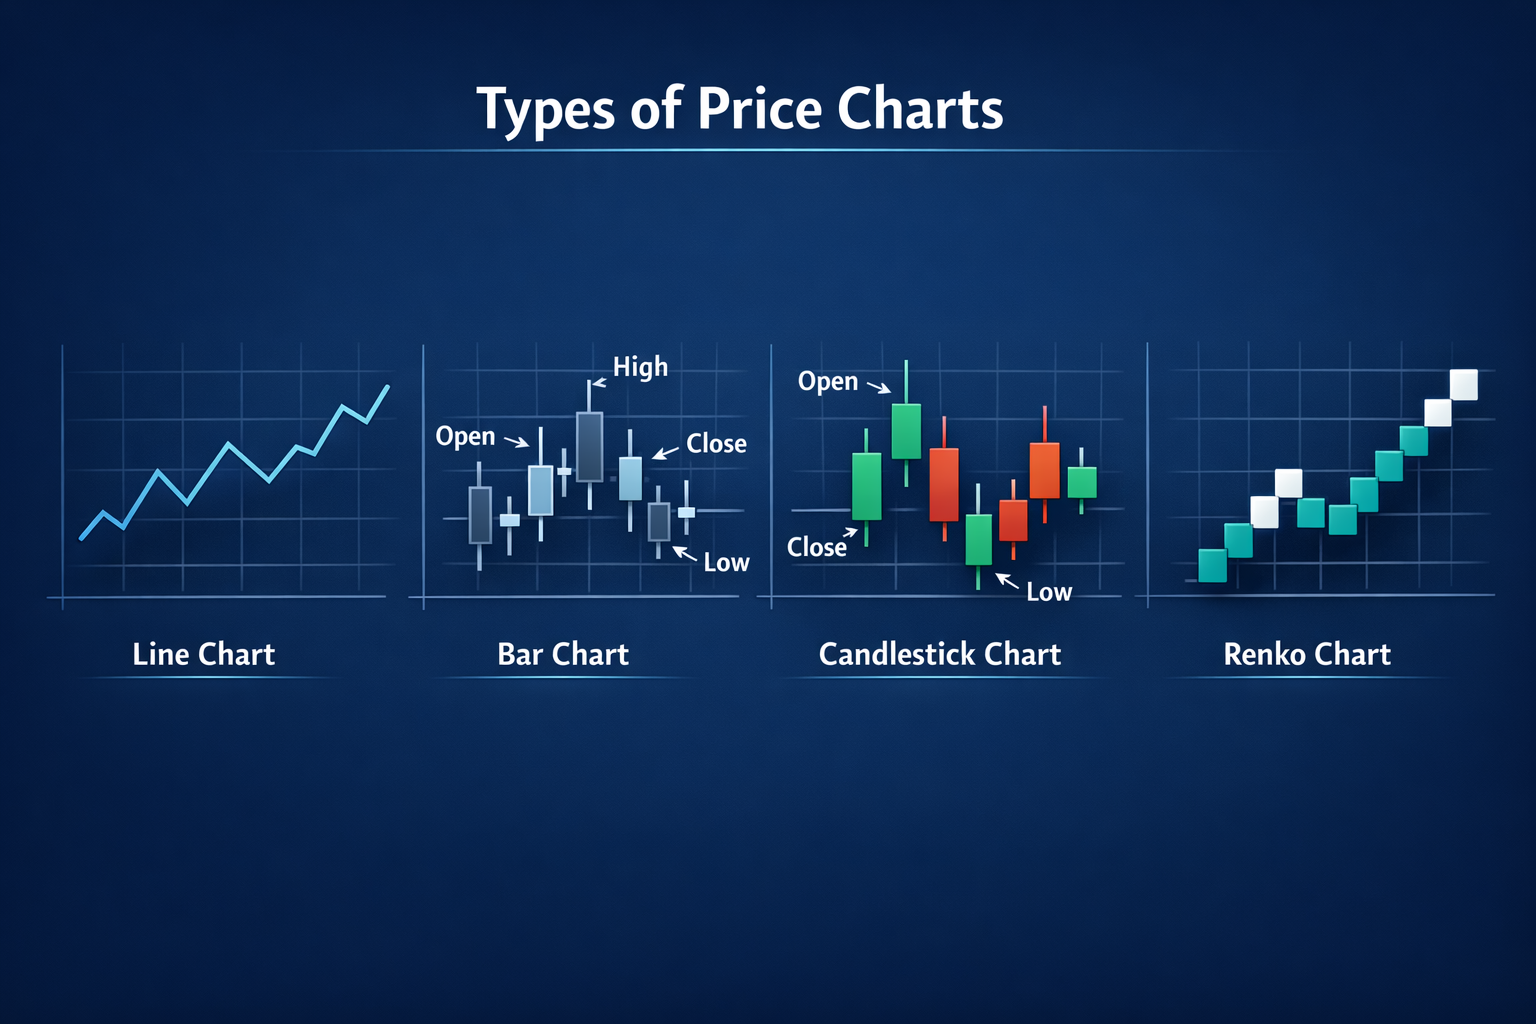
Stock charts can be represented in multiple formats such as line charts, bar charts, and candlestick charts. Each format organizes price data differently but represents the same underlying information.
Market Context (India-specific)
In Indian markets, charting platforms used for NSE and BSE data commonly provide candlestick charts, which display open, high, low, and close prices for a given time period.
Behavioural Considerations
Beginners may assume that different chart types represent different market realities, whereas they are simply different visual representations of the same data.
Time Frames in Stock Charts
Time frames define the interval at which price data is displayed, such as minutes, hours, days, or weeks. This affects how price movement is observed.
Market Context (India-specific)
In Indian markets, different participants observe charts across various time frames depending on their approach, contributing to layered market behaviour.
Behavioural Considerations
Learners may switch between time frames without understanding how this changes the interpretation of price movement.
Understanding Candlestick Representation
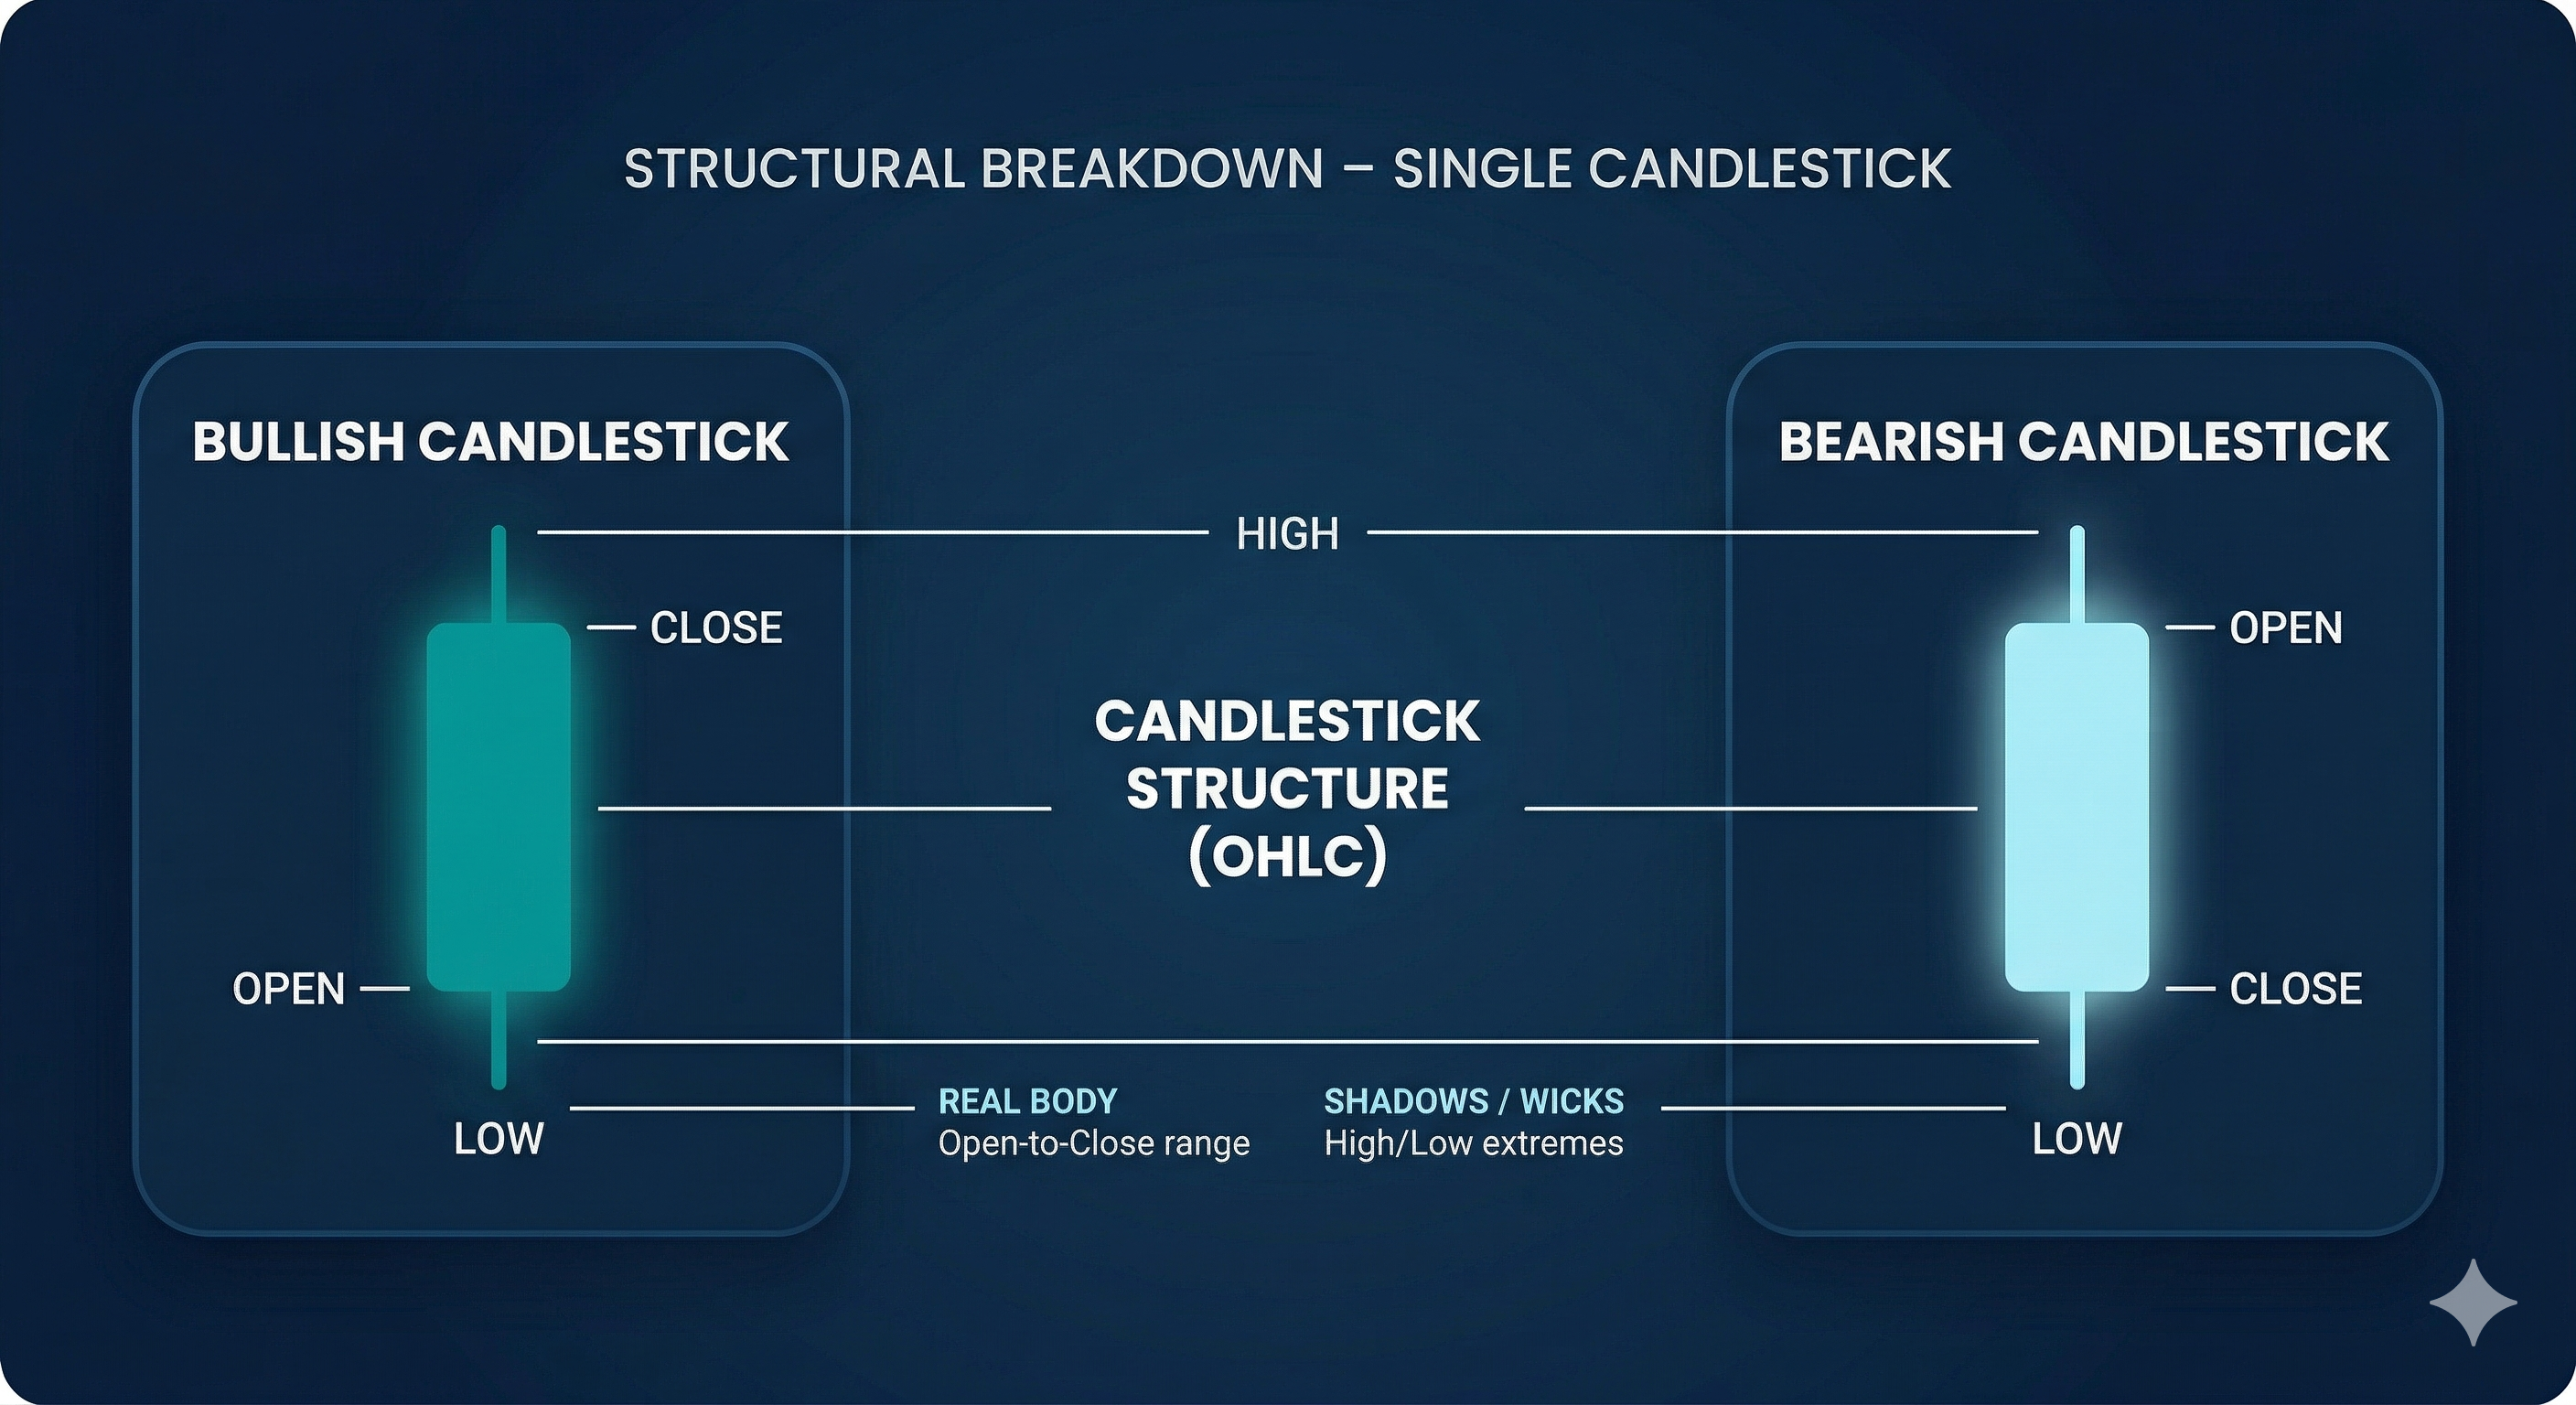
Candlestick charts display four key data points: opening price, closing price, highest price, and lowest price within a specific time period.
Market Context (India-specific)
Candlestick charts are widely used in Indian equity and derivatives markets due to their ability to visually represent price movement clearly.
Behavioural Considerations
Beginners may focus on individual candlestick shapes without understanding the broader context of price behaviour.
COMPARISON TABLE
Concept Core Issue Market Impact Learning Challenge
Chart Types Different representations Same underlying data Understanding formats
Time Frames Variable intervals Different perspectives Maintaining consistency
Candlesticks Visual complexity Detailed price view Interpreting structure
KEY TAKEAWAYS
stock charts represent price movement over time
different chart types display the same data differently
time frames influence interpretation of price behaviour
candlestick charts provide detailed price information
understanding charts does not determine outcomes
COMMON BEGINNER MISTAKES
interpreting charts without understanding structure
confusing different chart types as separate systems
switching time frames without clarity
focusing on patterns without context
assuming charts predict future movement
ignoring broader market behaviour
LIMITATIONS
Stock charts provide a visual representation of historical price movement, but they do not capture all factors influencing financial markets.
Market behaviour is affected by liquidity, institutional participation, and macroeconomic developments, which may not be fully reflected in chart visuals.
In professional financial education, charts are considered observational tools rather than complete representations of market dynamics.
RISK AWARENESS
Investor awareness material published by SEBI highlights that misinterpretation of market data is a common issue among retail participants.
Financial stability insights from the Reserve Bank of India (RBI) emphasize that market behaviour is influenced by broader economic conditions beyond price charts.
These insights reinforce that charts should be understood within the context of overall market complexity.
WHAT THIS DOES NOT DO
Understanding how to read stock charts does not ensure successful participation in financial markets.
Understanding ≠ outcome.
BEGINNER LEARNING PATH
Step 1 – understand basic market terminology
Step 2 – learn how price data is represented on charts
Step 3 – study different chart types
Step 4 – explore time frames and their impact
Step 5 – develop awareness of market complexity
FAQ SECTION
What is a stock chart in the Indian stock market?
A stock chart is a visual representation of price movement over time based on market data.
Why are charts important for beginners?
They help in understanding how price movement is structured and displayed.
What is the most commonly used chart type in India?
Candlestick charts are widely used in Indian markets.
Do charts predict market behaviour?
Charts represent historical data and do not predict future movement.
Why do beginners struggle with charts?
Because charts involve multiple elements that require structured understanding.
AUTHOR
Vicky Mehta is a stock market trainer with over 20+ years in financial markets and the founder of Succinct Learning Platforms Pvt. Ltd.
He holds an MBA in Financial Markets in collaboration with NSE Academy and is an NSE Certified Market Professional.
His work focuses on structured financial education, risk management frameworks, and disciplined market understanding.
SOURCES
SEBI – Investor Awareness & Protection material
NSE – Market activity and derivatives participation
RBI – Financial Stability Reports
DISCLAIMER
This article is provided for educational and informational purposes only and should not be interpreted as investment or trading advice.
Financial markets involve risk, including the potential loss of capital. Readers should consult a SEBI-registered investment advisor before making financial decisions.
other related topics
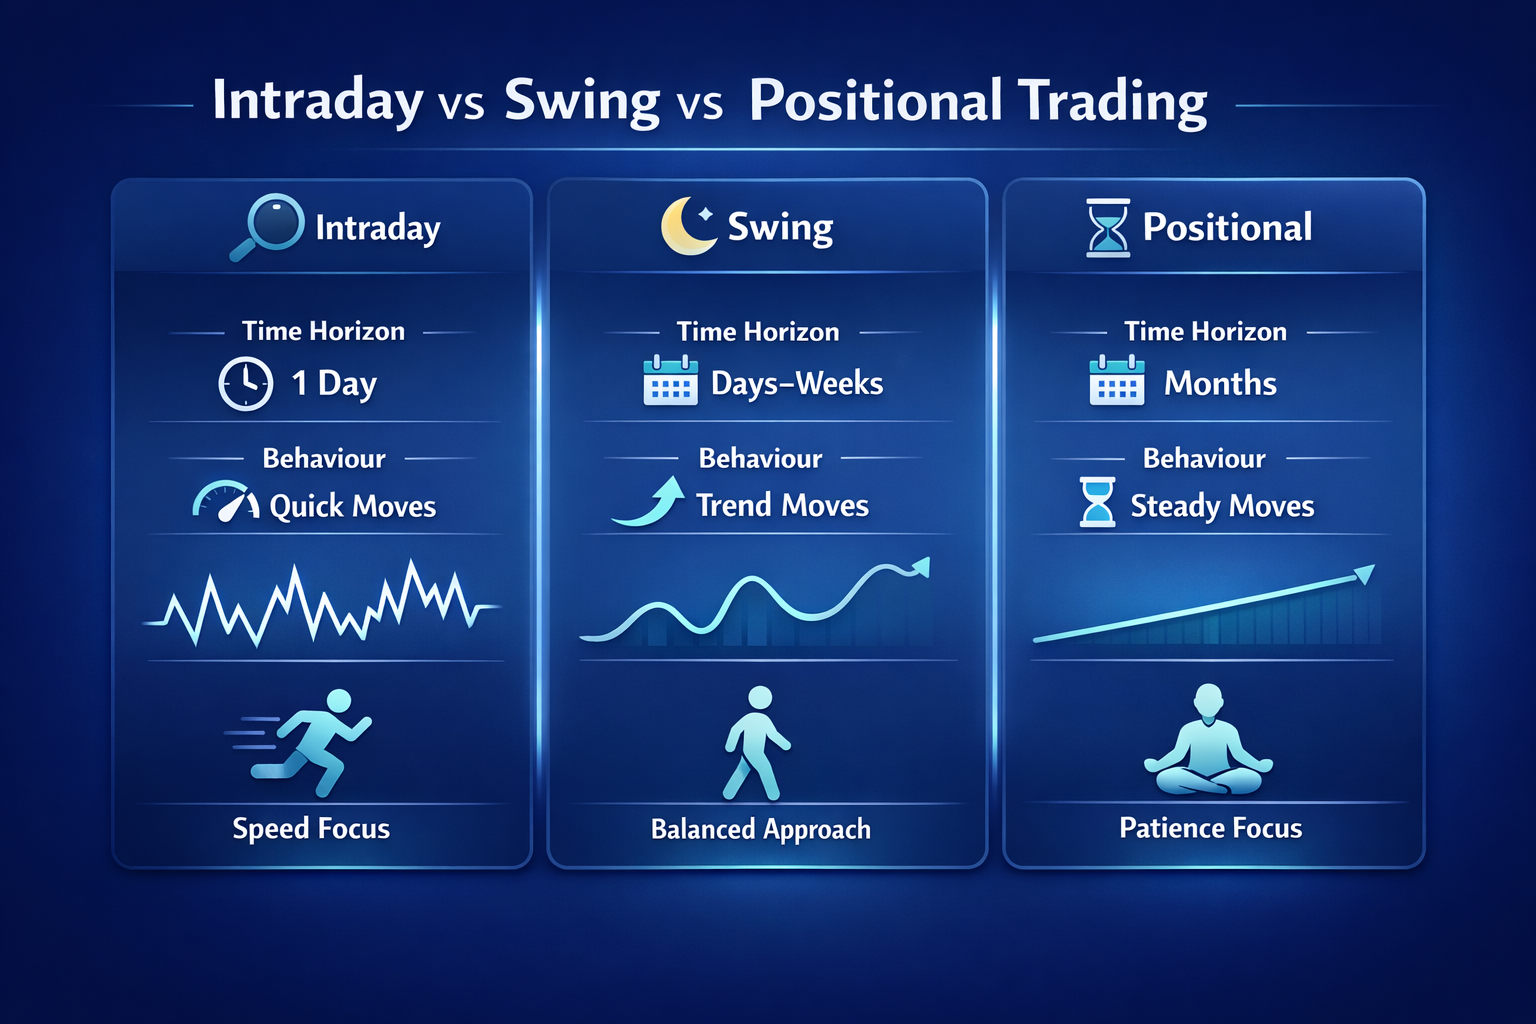
Intraday vs Swing Trading: Which is Better for Beginners?